Welcome to the resources page! I would like to share helpful academic resources here.
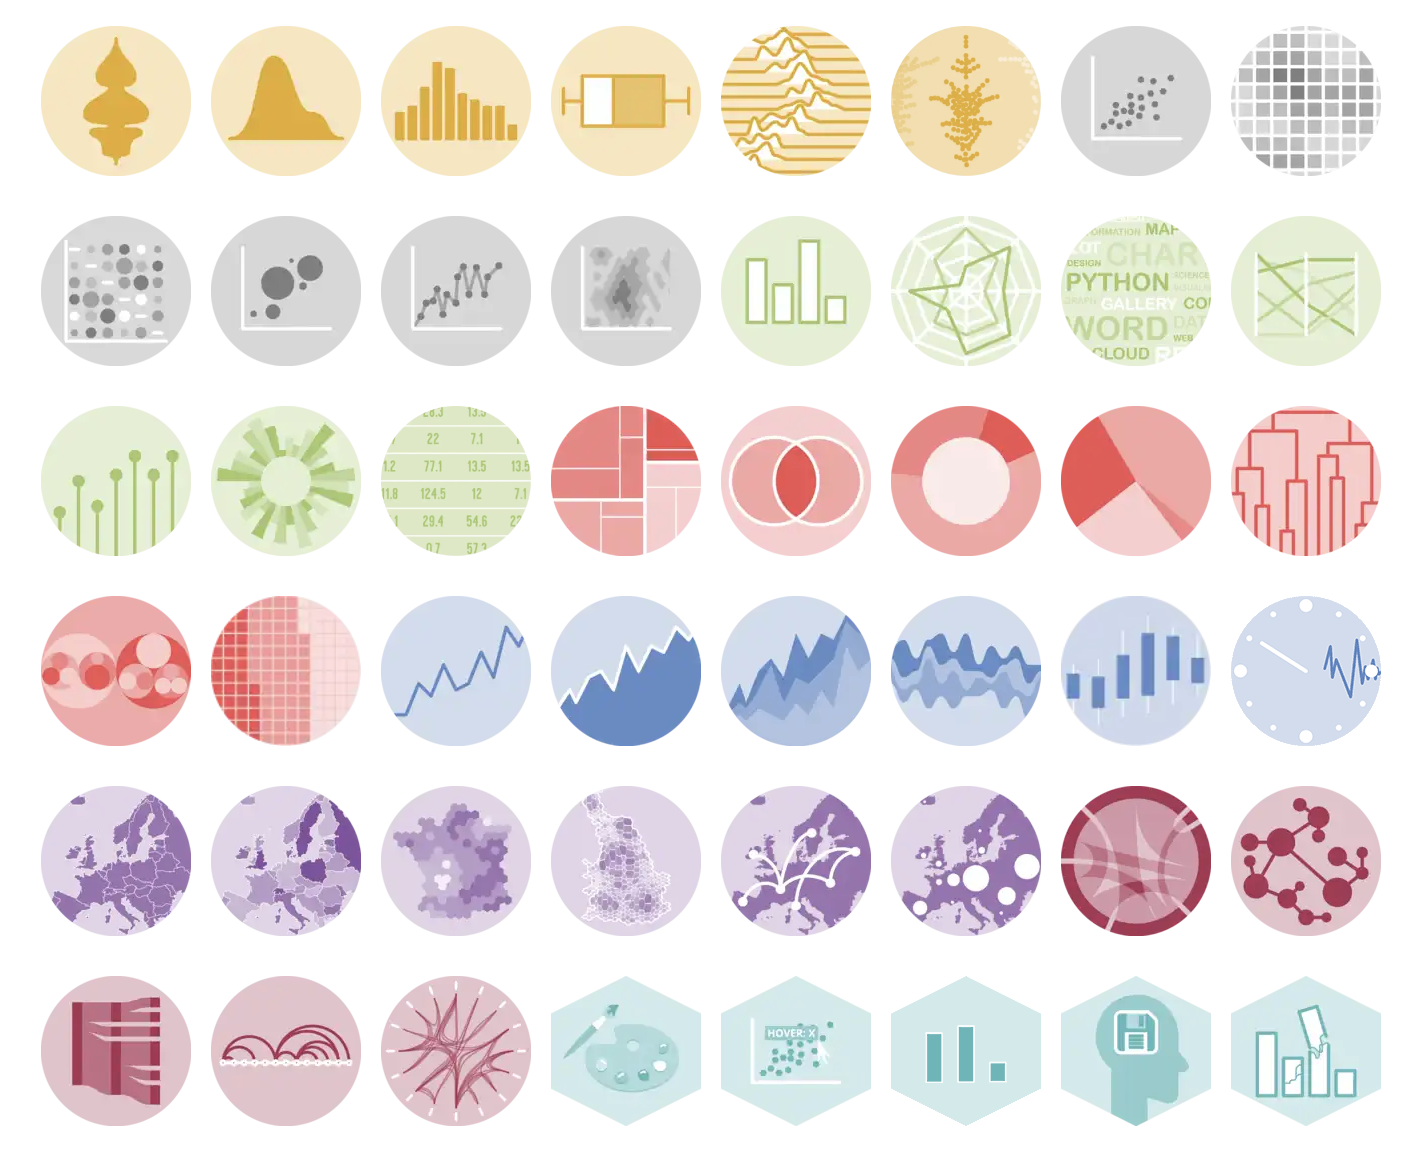
The Python Graph Gallery
The Python Graph Gallery is a website that displays hundreds of charts made with Python, together with their reproducible code.
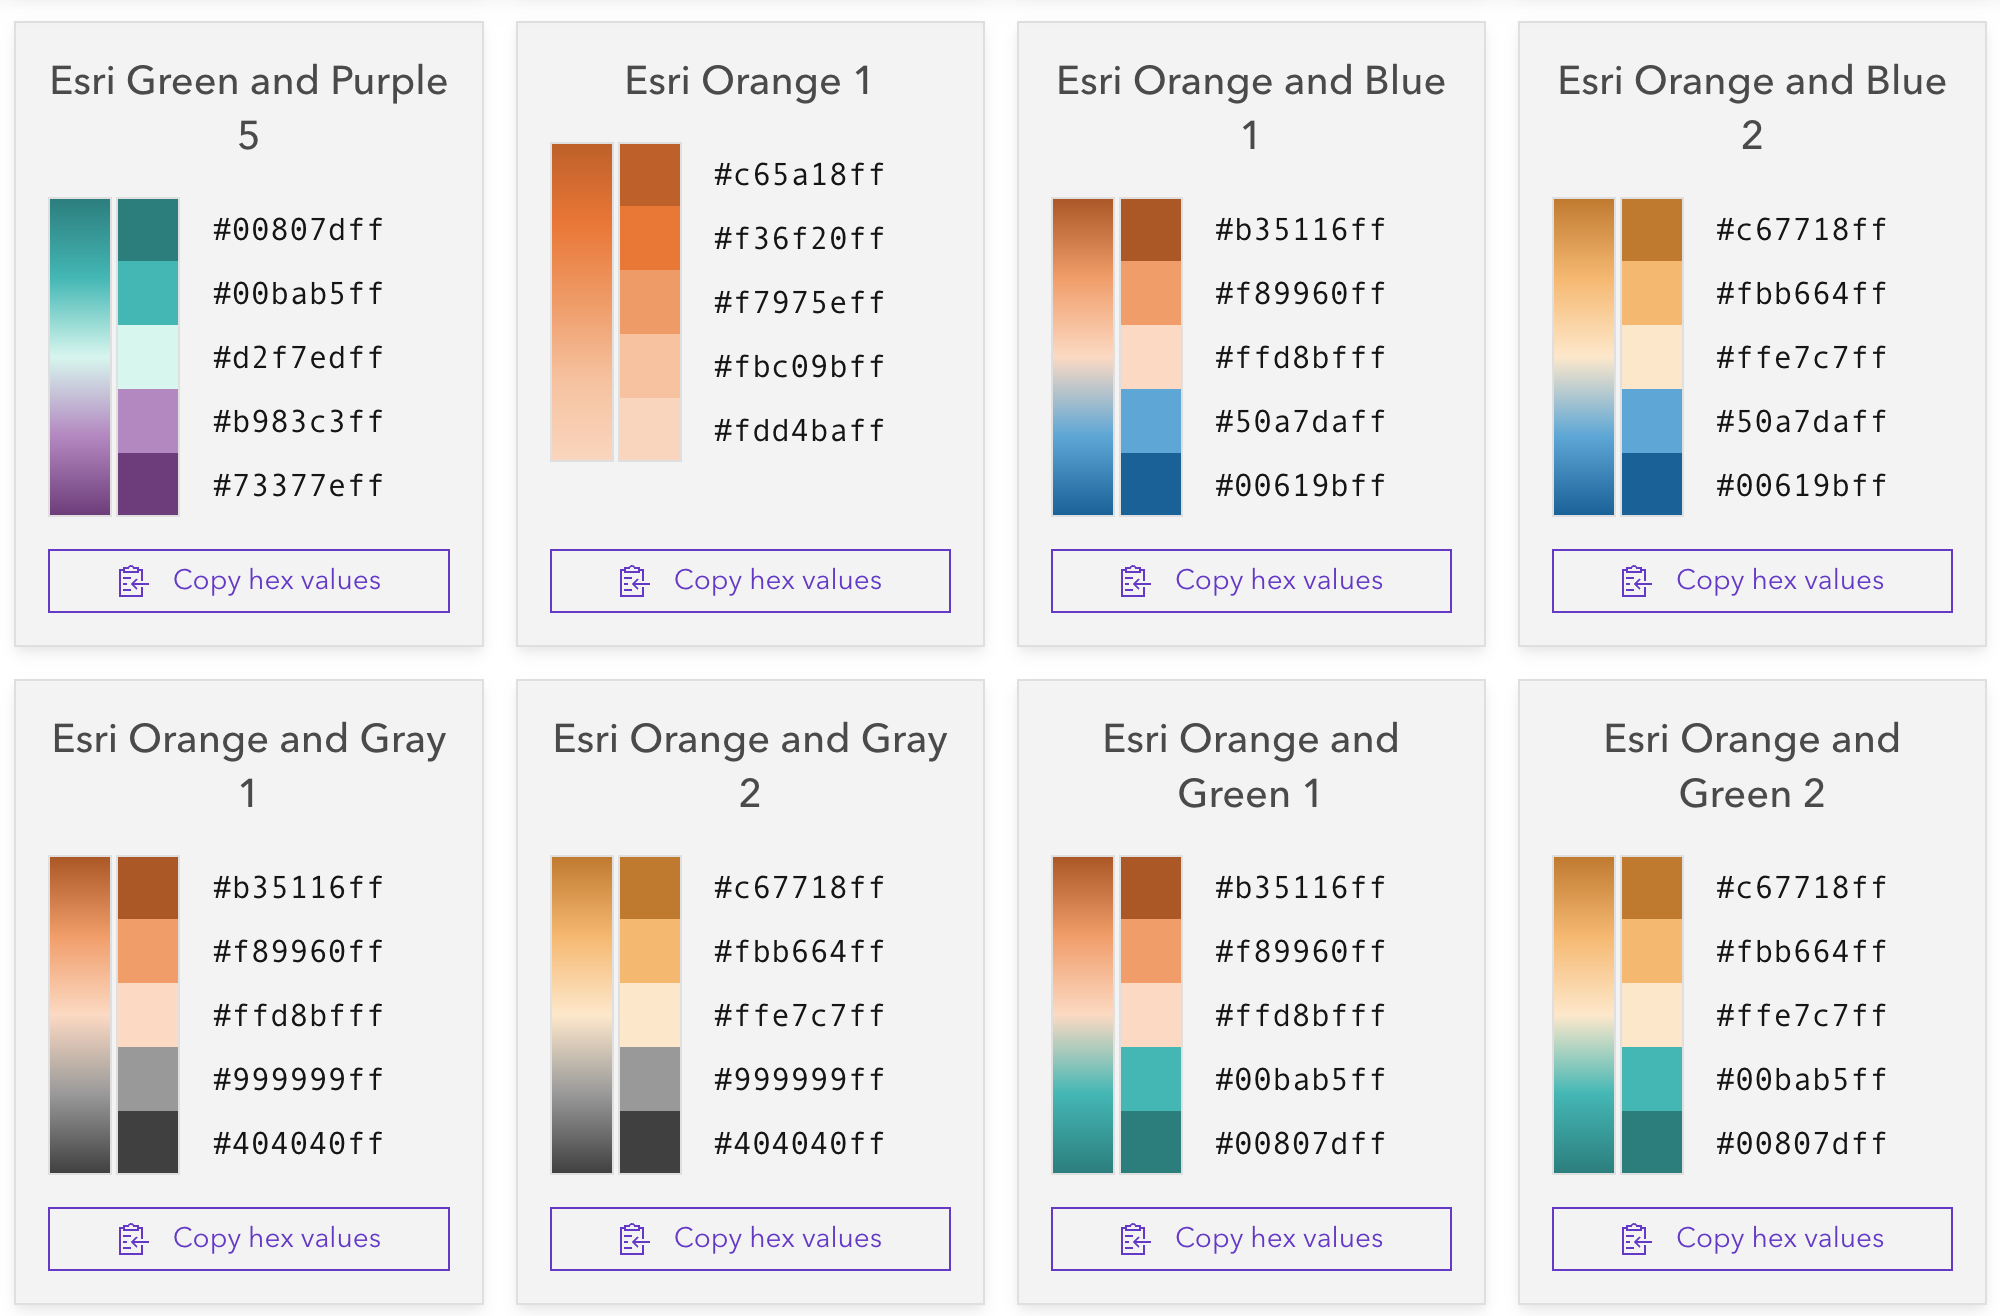
Esri Color Ramps
The ArcGIS Maps SDK for JavaScript provides hundreds of color ramps to developers to improve the mapping experience. Numerous cartographers with decades of experience in color theory and knowledge of how perceptual differences between colors work created these color ramps using Adobe Illustrator.